Trading Pattern Spotlight
Doji
Candlesticks
Doji are one of the most iconic varieties of Japanese candlesticks. They have a distinct look and appear often, so they are widely known and recognized. While not a signal onto themselves, doji are a component of many candle patterns and can play a pivotal role in price action.

Money Tier
What Is a Doji Candlestick?
A doji is a candlestick with no body. They may have long or short wicks in either direction. In extremely rare cases, they may even have none. Doji are seen as a sign of market indecision, as they show price opening and closing at the same price over a given time period.
Why Doji Candles?
Doji are a must-know feature of price action. Overall, they are a simple yet useful concept that every trader learns about early on.
I don’t claim to be an expert on anything I write about.
Hell, I hardly claim to be an expert on myself. 😂
These breakdowns are largely for me. I use them to record and reference. Unlike most others on this site though, this doji candlestick breakdown is probably one of the best on the Internet.
Chart Narrative
Like all candlesticks, doji are a way to visualize the story in the charts. They are something like a main story beat.
Indecision Indicator
Doji are certainly not a true signal unto themselves. But they do represent a period of uncertainty in the market.
Price Discovery
Doji are often the result of ranging behavior, as price whipsaws in search of strong support and restistance.
Inflection Points
Doji like to pop up at pivotal moments in the market—reversal, continuation, consolidation—they’re everywhere!
There’s a lot that goes into understanding candlestick charts. Here’s a quick look at my doji candle learning journey.

Learn with Me
For the most part:
I’m still a Trading newbie.
However, I have written extensively about doji and other kinds of Japanese candlesticks (and Japanese candlestick patterns) for Playing Markets. I think I’m in the top 1% on this topic.
It’s say to safe I have a near-total understanding of them. After all, it’s not like they are complex.
Not to mention, you see them every single day when trading.
Through the osmosis this creates, I’m sure I’ll learn more on an intuitive level. However, I don’t think there are very many more “facts” I need to memorize about doji candlesticks.
I’ve got a full grasp on doji, as seen on This Site and PlayingMarkets.net.
My Experience
I’m been familiar with dojifor over a decade.
I can’t quite say I’m a master, but I definitely know a lot.
I’ve seen and interacted with doji candles countless times. Aside from daily trading, I’ve also produced one of the most extensive breakdowns of doji candlesticks on the whole Internet.
I know how to recognize, interpret, and trade them.
- Importance – 90%
- Frequency – 95%
- Mastery – 95%
Where Dojis Fit
Experienced traders know:
Nothing is the end-all-be-all when it comes to trading. Plus, candlesticks aren’t really that well suited as standalone trading signals. They’re more like a basic building block of technical analysis. They help you understand the story in the charts, otherwise knowns as price action.
Doji specifically, are like a small sign of indecision more than anything else. The longer the wicks, the more this is true. (Price travels a longer distance to end up in the same place.)
Where Doji’s Fit in the Money Games
Doji are one of the most iconic pieces of the Technical Analysis puzzle.
For me, they’re a “Tier 7” Trading concept, like the Hammers, Marubozu, and other Candlesticks.
They are also a key part of many Candlestick Patterns.
1. Playing Markets
2. Trading
3. Technical Analysis
‣ 4. Candlesticks
4. Chart Patterns
4. Indicators
Trading Courses
Trading Videos
Mentions on My Sites
Words Written
(Casual***) Doji Candle Trading Ideas
Price Ranges
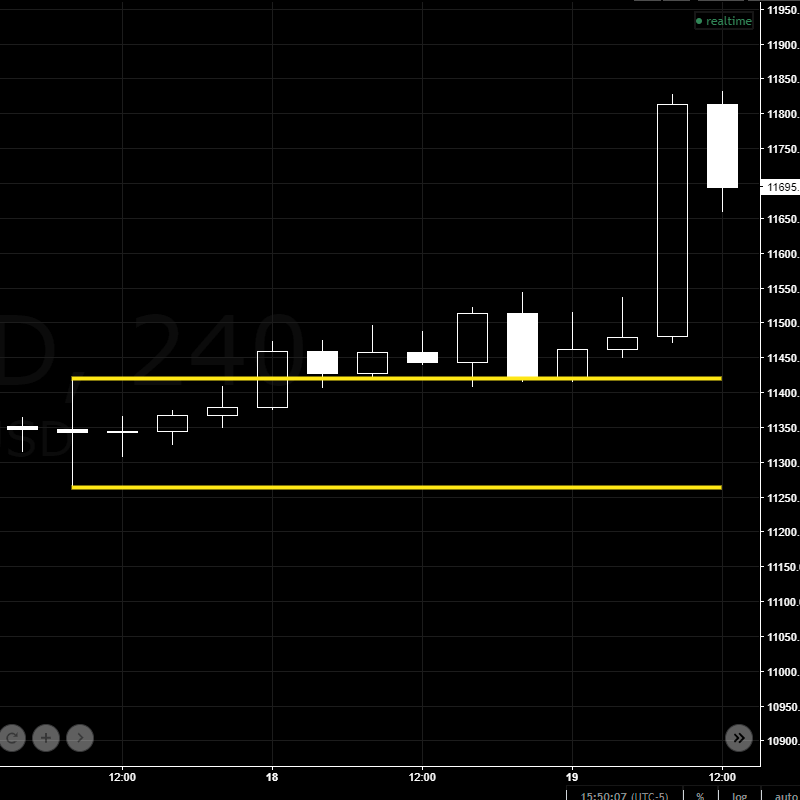
Doji candles can help establish important price ranges.
In the example above/to the left, the doji candle set an important price range. It did not provide a directional bias, but its wicks set shorter-term support and resistance levels.
After closing above the range, price returned to the top level, tested it as support, then continued upward.
Trade Idea***: Buy the breakout and set your stop loss at the top of the doji’s upper wick. Or, wait for price to retest the former resistance level and turn it into support before entering the trade.
Reversals
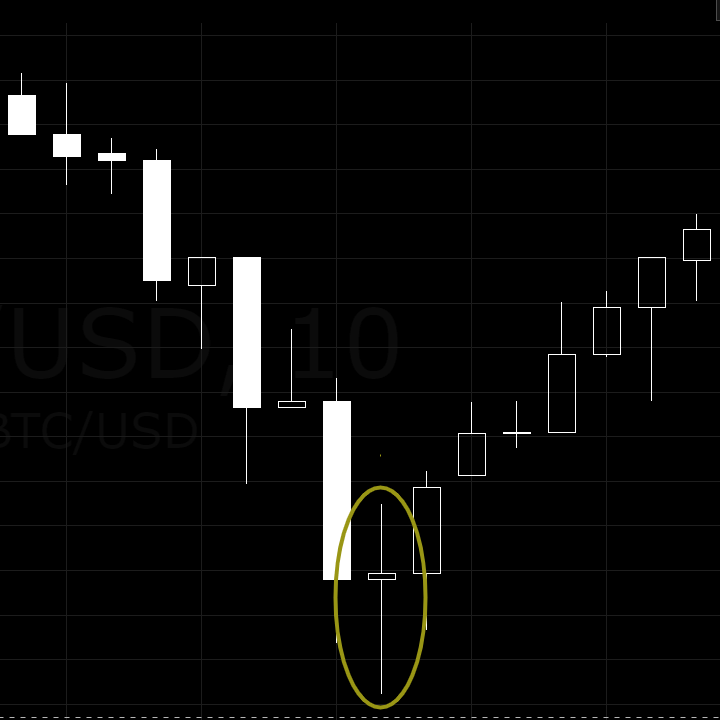
Doji candles can help indicate price reversals.
In the example above/to the left, the large doji appears after a series of large bearish candles. This illustrates a potential change in momentum as the bulls attempt to establish a swing low.
After closing above the doji’s upper wick on the next candle, price proceeded to recoup a substantial percentage of its most recent losses.
Trade Idea: Buy after the close above the doji confirms and set your stop loss at the doji’s low. Move your stop up to the doji body then the top of the doji as price increases.
Continuation
Continuation
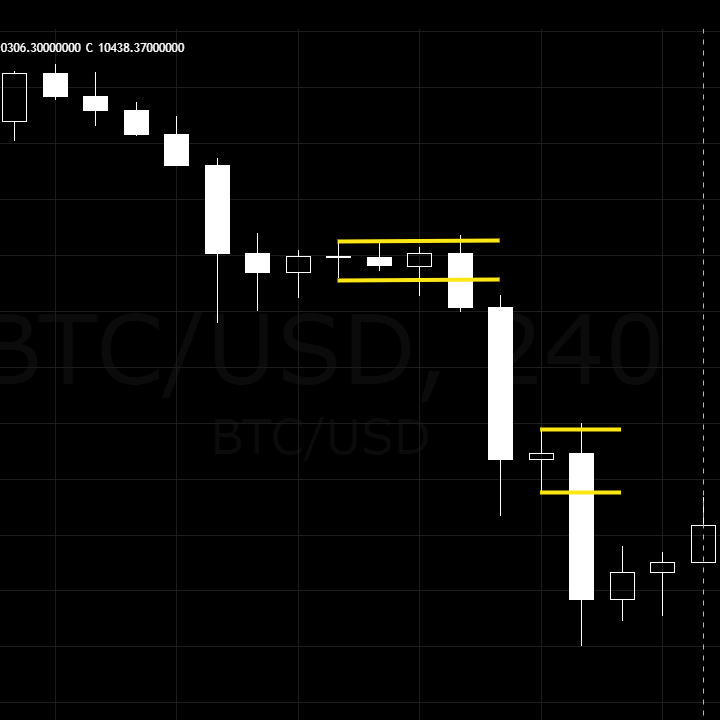
Doji candles can help set up continuation.
In the example to the left, the doji candlesticks appear during consolidatory phases in a downward move. They represent slight pauses more than meaningful bounces.
When momentum is strong, doji can be a sign of a lack of conviction from countertrend traders.
Trade Idea***: If you anticipate continuation, try to buy at the doji high and set your stop loss above it. Manage stops, take profits, and look for new entries as needed, perhaps within later doji candles.
***Doji candlesticks alone give nowhere near enough info to base trades on. You would need a lot more identify ranges, reversals, and continuations.

Where Doji Candlesticks Fit in the Game of Playing Markets
Doji candlesticks are one of the most common, recognizable features of candlestick charts.
Most traders see doji every single day, since 99% of them use candlestick charts to analyze price action. They are a nearly inescapable aspect of a Playing Markets—Trading especially. If you look at virtually any price chart for 2 min you’ll see them. They show up in stocks, cryptocurrency, and all other tradeable assets.
However, any single candlestick can only reveal so much.
Not even a passage in the story, individual candlesticks are more like a sentence or a paragraph. Heck, if the story is long enough they might only be a word or a letter. Without their peers for context, they’re little more than lines on a screen.
In the end, how candlesticks work is one of a long list of things you need to learn to master technical analysis. It’s fundamental, to be sure. But so is Trend, Support and Resistance, Candlestick Patterns, and Chart Patterns. Plus, you have an endless number of Indicators and Signals to choose from.
And all of that is before you even get to Trade Strategy! 😅
With that said, trading is fun for many (though stressful). It’s interesting to see how the beats fit together to write the Story in the Charts.
Doji are a building block of that story.
If you want to learn more about them, I wrote The Most In-Depth Doji Candlestick Guide on Planet Earth for Playing Markets. Check it out!
Other Candlestick Types
Hammer
Marubozu
Shooting Star
My Top Three Trading Teachers
YouTube University is my go-to for trading training. I've completed several programs and keep up with these guys weekly.
Final CTA
Money link, playing markets mention/link
Nice little subtitle for the win. Nice little subtitle for the win. Nice little subtitle for the win. Nice little subtitle for the win. or the win.
![]()